

Better Data Makes Lab Management Decisions Easier with AUTOMATE
Magnet AUTOMATE takes your lab’s operational data and presents it in easy-to-consume visual dashboards to help you drive success and efficiency in the lab.
One of the first steps towards improving your labs performance and efficiency is understanding the details – such as case throughput, tool utilization and workflow usage. But does tracking lab metrics and statistics involve countless Excel sheets and manually recording data on a regular basis? Or perhaps there’s information that you’d like to know that would be almost impossible to uncover via manual methods, such as workflow usage?
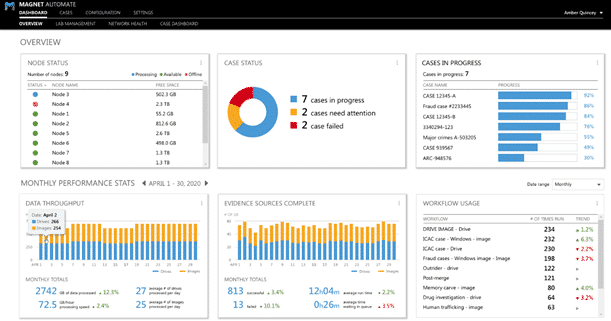
The Overview and Case Dashboard provides lab managers with a high-level overview of lab operations and efficiency metrics to drive lab improvement and resourcing decisions. These new management dashboards allow you to assess overall data throughput, workflow usage, cases in progress and the number of evidence sources processed.
Additionally, the Overview Dashboard works well as a head-up display on large monitors or TVs displayed in-lab keeping everyone on the same page, or to visually communicate with management visiting the lab.
Deep visibility into your lab’s stats and performance helps you:
- Quickly identify and act on lab hardware issues (within infrastructure visible to AUTOMATE)
- Report on the ROI and value of your investment in AUTOMATE
- Assess lab operations to make data-backed decisions regarding resource allocation, hardware & software procurement and strategic hiring decisions
Quickly Identify and Act on Lab Infrastructure Issues
If a server or tool experiences an error, the ability to process cases at maximum capacity and efficiency will be impacted. This goes beyond ensuring consistent ROI — it’s important for you to be able to assess the health of your lab’s infrastructure quickly and at a glance so that you can take immediate action. The new Notifications, Node Status and Case Status modules on the Overview and Case dashboard help you always keep your lab running smoothly.
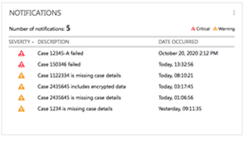
Notifications Module: An instant view of which cases require immediate attention. This table summarizes what cases are currently pending additional details or were unsuccessfully processed and require manual intervention
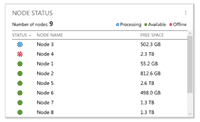
Node Status: Provides a detailed breakdown of which nodes are online, offline, or currently in use as well as their available disk space so an examiner knows when they need to procure more drive space for a machine.
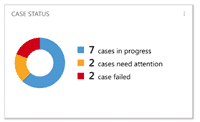
Case Status: Shows the current processing status of the lab including how many cases are processing, failed, and pending. The seven-day totals show approximately how many cases successfully and unsuccessfully completed processing, giving the lab manager quick stats that they can report on.
Report on the ROI and Value of Your Investment in AUTOMATE
AUTOMATE tracks the total number of evidence source types processed, such as drives or image, as well as total data throughput so that you can measure the overall productivity and efficiency of the lab. By comparing pre- and post-AUTOMATE deployment statistics, you’ll be able to prove and justify your investment in DF automation & orchestration to management. By showing exactly how many more pieces of evidence and data your lab crunched through in comparable periods of time, you’re showing the value of eliminating machine downtime and manual, repetitive steps in the workflow.
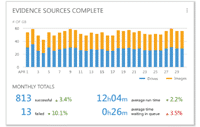
Total Number of Evidence Sources Processed: Shows how many evidence sources AUTOMATE has processed, as well as which type your lab processes more of such as Drives or Images. You’re able to configure this to show the total over a period of time (daily, weekly, monthly, annually).
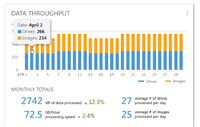
Data Throughput: Shows how much data has been processed in AUTOMATE, and which evidence type the majority of this data came from such as Drives or Images. You’re able to configure this to show data processed over a period of time (daily, weekly, monthly, annually).
Assess Lab Operations to Make Data-Backed Decisions
Lab operational insights can be a powerful tool when stocking your lab — whether it’s resource allocation, hardware & software procurement, or hiring decisions. With the right data and insights, you can feel even more confident that the decisions you’re making within the lab will best serve the agency’s needs and priorities.
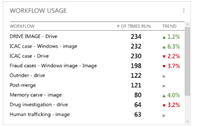
Workflow Usage: Lab managers can use this information to show how often a workflow is used. This will give the lab manager the ability to track trends around how often a workflow is used (or not) to help them identify efficiencies in the lab, as well as what skills may be required if they’re planning to hire new examiners. This module can also help you make data-backed decisions about procurement if a certain workflow and associated tools are underused.
Learn More About Magnet AUTOMATE & Request a Consultation
Visit the Magnet AUTOMATE page to learn more about AUTOMATE and to request a personalized demo and consultation with one of our experts today.