
SRUM: Forensic Analysis of Windows System Resource Utilization Monitor
SRUM, or System Resource Utilization Monitor, is a feature of modern Windows systems (Win8+), intended to track the application usage, network utilization and system energy state.
SRUM, as with most operating system features, wasn’t designed for the forensicator, but that doesn’t mean we can’t use it to support our investigations.
Let’s look at some things you can gain, and some you can’t, from investigating the System Resource Utilization Monitor.
Accessing SRUDB.dat
The SRUM database is stored in C:\Windows\System32\sru\SRUDB.dat. The file is an ESE (Extensible Storage Engine) database. This is the same kind of database utilized by Active Directory, Microsoft Exchange, Microsoft Search, and others. Information is written to the database hourly and at system shutdown.
In the interim, information not yet captured to the database is stored in the registry. This is important as depending on the timeframe of your response and the time between the activity and the acquisition, the information you’re looking for may not have been written to the database yet.
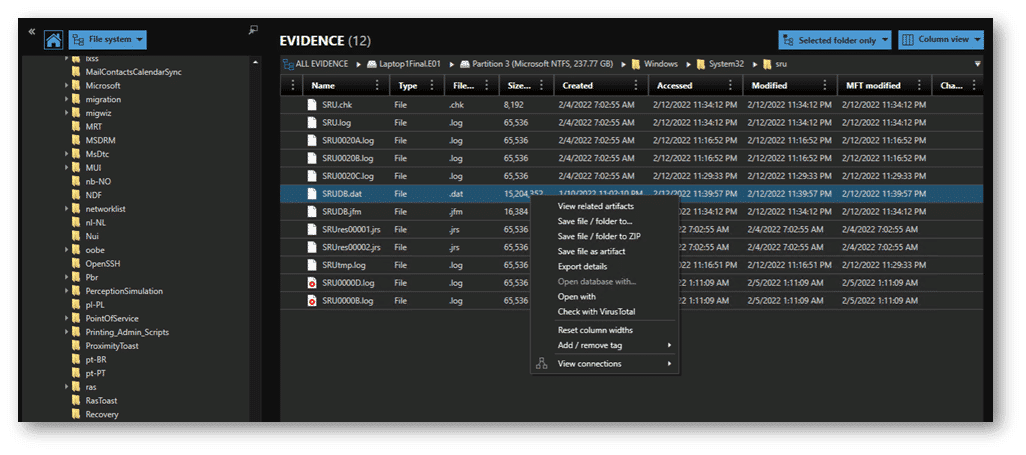
If you’re doing dead disk forensics or working from an image, you can grab the database from its path at C:\Windows\System32\sru\SRUDB.dat. On a live system this file will be locked and can’t be accessed with normal copy & paste routines.
Installing a forensic imager on the host will enable you to make an export of the SRUDB.dat, as well as grabbing registry hive files. However, running a software installation on a live host under investigation is not preferable. The more changes you make, the more volatile data you could be overwriting. This imager method could be useful for a lab environment where you’ve got tools pre-loaded, but it’s very unlikely you’ll walk up to a host for examination in the field like this.
Another utility for live extraction is SRUM-DUMP from Mark Baggett: https://github.com/MarkBaggett/srum-dump. For live acquisitions (admin rights required), SRUM-DUMP utilizes f-get.exe (included with the download) to make a copy of the live file. SRUM-Dump uses an Excel template to parse collected database into a spreadsheet. If you only want to grab the SRUDB.dat and skip the Excel manipulation, you can run just the f-get command (see Mark’s ReadMe for syntax). Personally, I prefer having the Excel results as well for validation of my primary forensic tools.
System Resource Utilization Monitor Artifact Categories
System Resource Utilization Monitor artifacts are divided into categories:
| SRUM Application Resource Usage | SRUM Network Connections |
| SRUM Energy Usage | SRUM Network Usage |
| SRUM Energy Usage (Long Term) | SRUM Push Notification Data |
SRUM Application Resource Usage
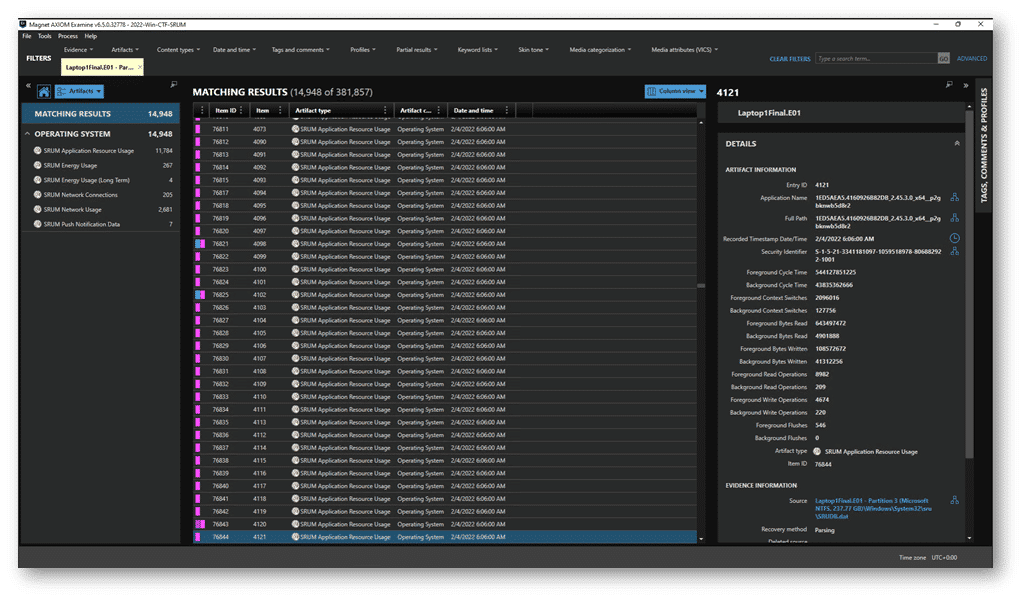
Of the different artifact categories, SRUM Application Resource Usage is one of the most useful, and usually the noisiest, of the categories. That’s because it’s tracking every exe that’s executed on the system whether it still exists on disk or not. If it executed, it should be logged.
SRUM Application Resource Usage stores the full path that the application executed from. This can help us filter down to un-expected application paths. Using the Advanced filters in AXIOM or AXIOM Cyber, exclude known paths and stack the exclusions to narrow the dataset. That makes it easier to identify unusual paths and the binaries running from them.
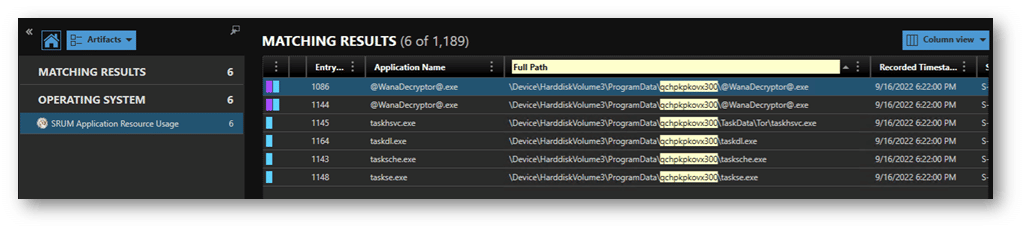
In the example below you can see activity from the WannaCry executing from ~\ProgramData\qchpkpkovx300\, certainly not a typical path name.
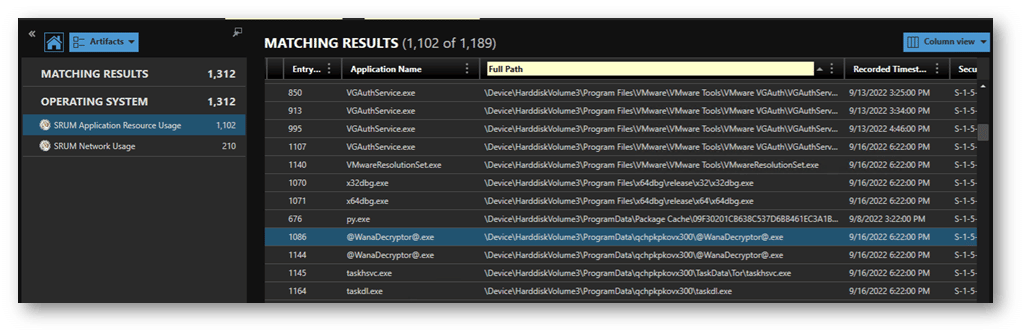
We can utilize this path information to see what other binaries have executed from this location, giving us further indicators to pivot from.
SRUM records the SID (Security Identifier) that executed the binary. This is another pivot point for the investigation: looking at what other activities occurred under that ID. When the binary executes using a System account it may be harder to sort the malicious activity from the benign. However, if the attacker created a user for their activities, executed their actions, and then deleted the user account, you will have a reasonably clear trail to follow revealing what applications were executed by the now deleted account.
SRUM Energy Usage (and Extended Usage)
SRUM Energy Usage captures statistics related to the charge and power state of the device. While this could be useful for corroborating how long a system was active and when it was plugged in, it’s a little more of a stretch to find immediate applicability to forensics unless the power cord is your murder weapon.
SRUM Network Connections
SRUM Network Connections can be utilized to identify when the asset was connected to a network. It will capture the connection start time and the interface type (ethernet or wireless), and the duration of the connection. This information could be coalesced with GPS data to support evidence of network activity at a time and place.
SRUM Network Usage
This is the second most useful category after Application usage. The SRUM Network Usage tracks wired and wireless connections and the network SSID (when wireless) the asset was connected to. It also captures bandwidth usage in bytes sent and received by application. As with other SRUM categories, these results include the full path of the application and the SID that executed it. If you suspect a data exfiltration event, you can utilize these artifacts to see what applications are responsible for the most data on the wire—either sent or received—and correlate to the user behind them.
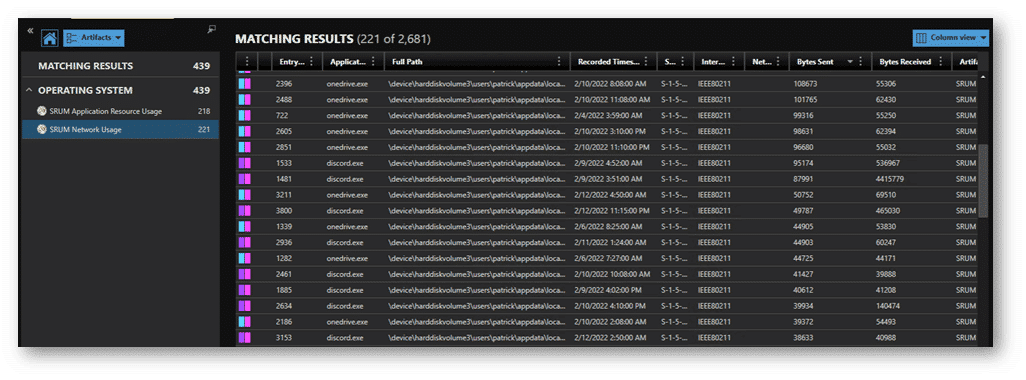
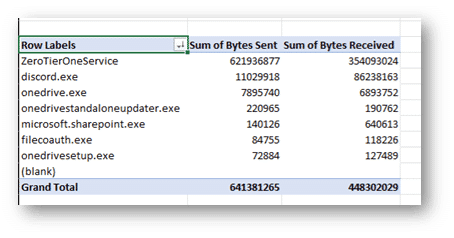
As seen in the example, there are multiple entries for the same exe. Think of these like TCP sessions with the same destination. In this case, it’s different application ‘sessions.’ If you need to quantify to total bytes sent or received for an application, highlight your included results and export to CSV. A quick pivot table in Excel will give you the cumulative results (in bytes) by application.
SRUM Push Notification Data
SRUM Push Notification Data reports on notification events displayed to the user. I’ve yet to find a practical forensic use for this data, but as we said in the beginning, SRUM wasn’t created for the forensicators.
A Lot to be Learned With SRUM
The SRUM database presents a plethora of artifacts and indicators for the analyst to use while pivoting through their investigation.
We can ascertain what identity was responsible for the execution of a process, the volume of data transmitted or exfiltrated, and a record of binary execution including files previously deleted from disk. We also have a time window of execution that we can leverage plus or minus an hour depending on database writes.
Whether these artifacts alone seal the deal, or add another positive indicator to our case, there’s a lot to be learned by pointing your lens at SRUM for another set of clues as to what took place and whodunnit.
If you want to learn more about artifacts useful to digital forensic investigators, check out our posts on Prefetch files, MRU (Most Recently Used), MUICache (Multilingual User Interface), LNK files, and Windows Shellbags.