
Analyzing data with Centralized Views in Magnet AXIOM
This post will outline the various views that Magnet AXIOM lets you use in your investigations and provides tips and tricks on how to get the most out of AXIOM’s Centralized Views.
Depending on the type of data you’re looking at, the presentation can really help with your analysis. Some views work really well with large datasets, while others work well with smaller datasets. Some work well when all the data being compared is the same, while others can assist with different types of artifacts being shown. The best views for examiners to use vary from case to case and the type of data being analyzed.
This is why we’ve added a number of different views to Magnet AXIOM. Some will be familiar to Magnet IEF users while others will be completely new. The best way to maximize views for your analysis, is to understand how each view works best.
As we go over the different views available in AXIOM, you’ll see that some are better suited for multi-artifact view, where others are more suitable for focusing on a single artifact.
Multi-Artifact vs. Single Artifact
One of the new features we added in AXIOM is the ability to view and compare different artifacts in the same pane (or all the artifacts in a case for that matter). This can be useful when you want to compare data from different artifacts that may have some common data between them, but not everything is identical. For example, if you want to view the web history between Chrome, Firefox, and IE, previously you would have had to look at each of them individually, but now you can view them all together at the same time.
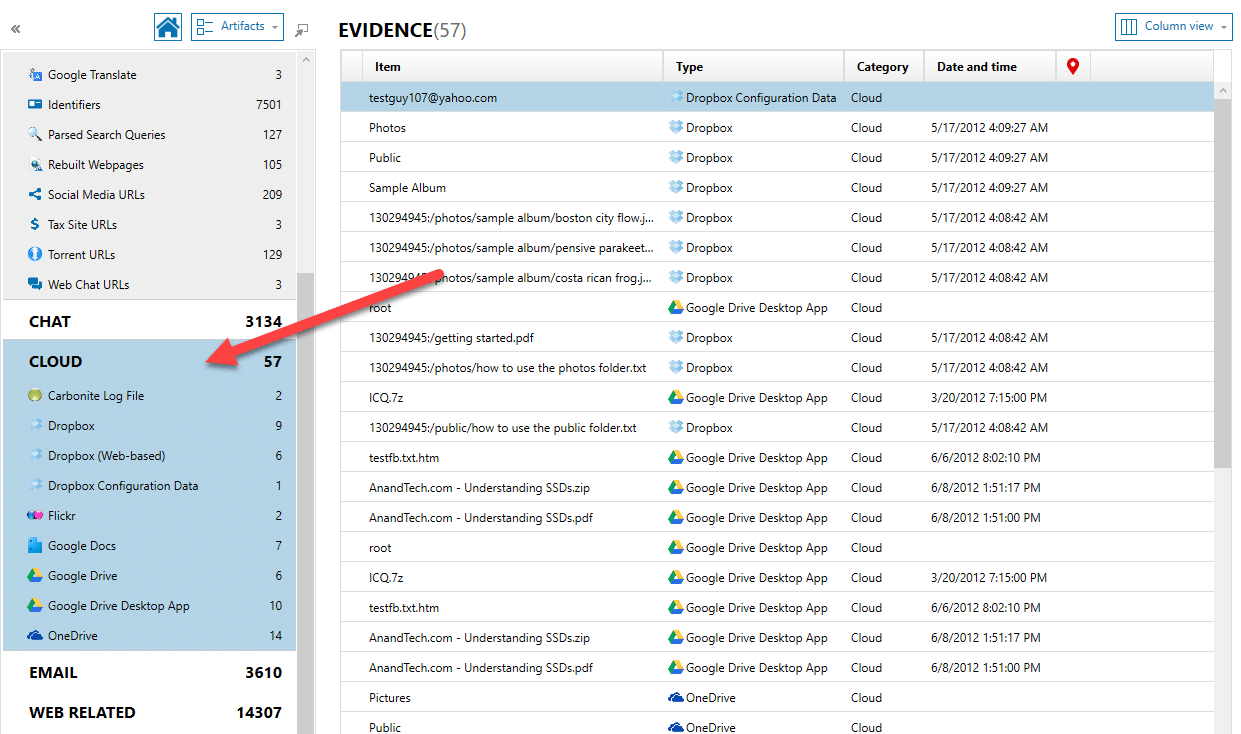
In AXIOM, we don’t list every column for all the artifacts you have selected in multi-artifact view (this would potentially give you hundreds of columns and is certainly not manageable), but we do present some common columns that might be important for the given artifact (including a timestamp, if one is available).
Column View
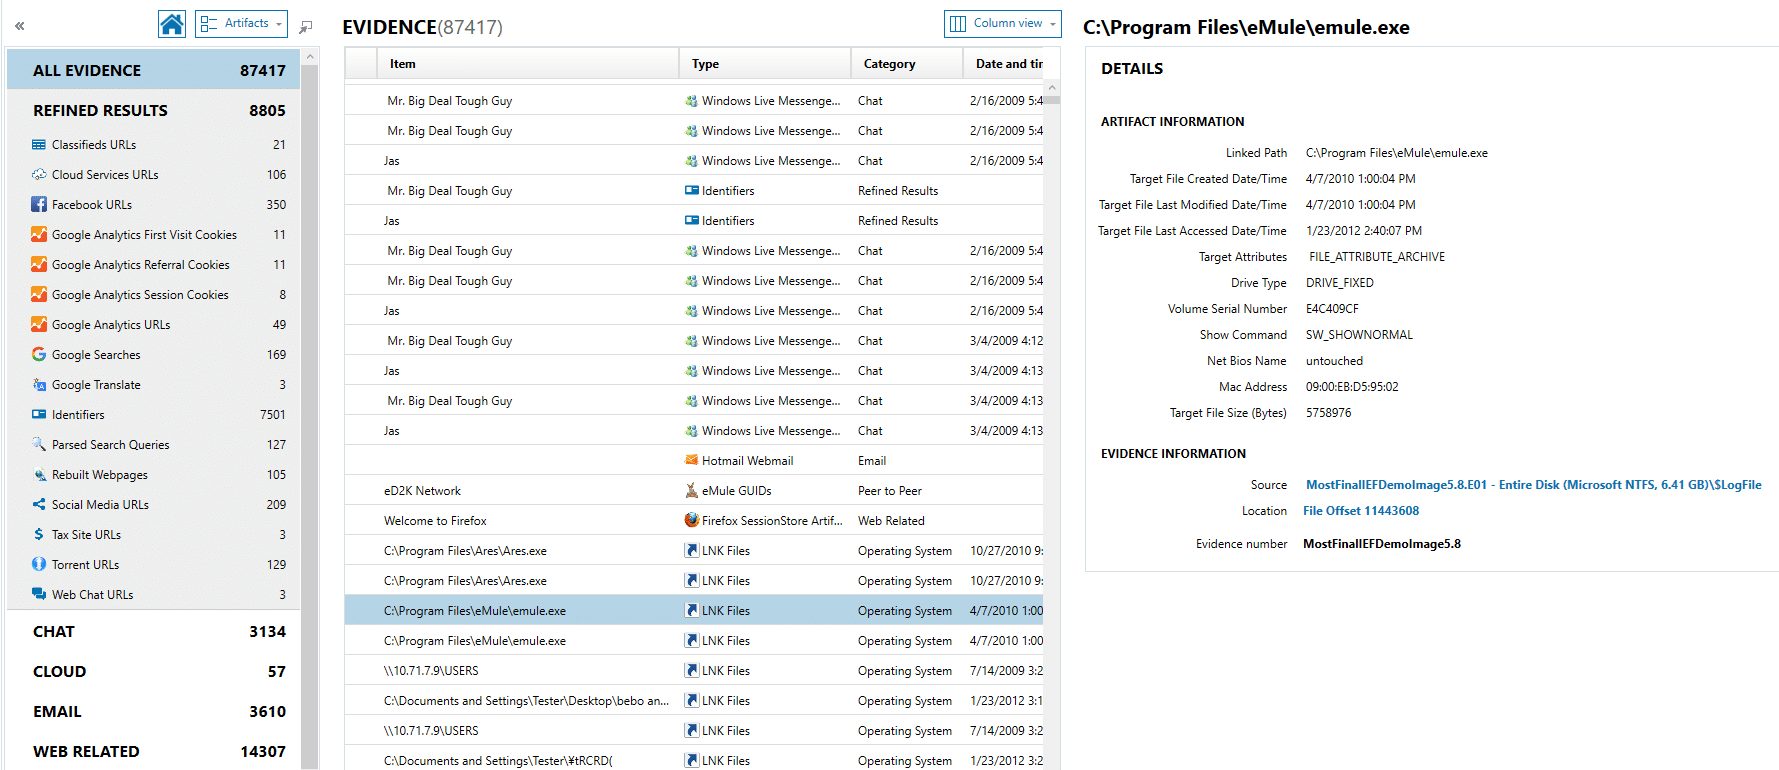
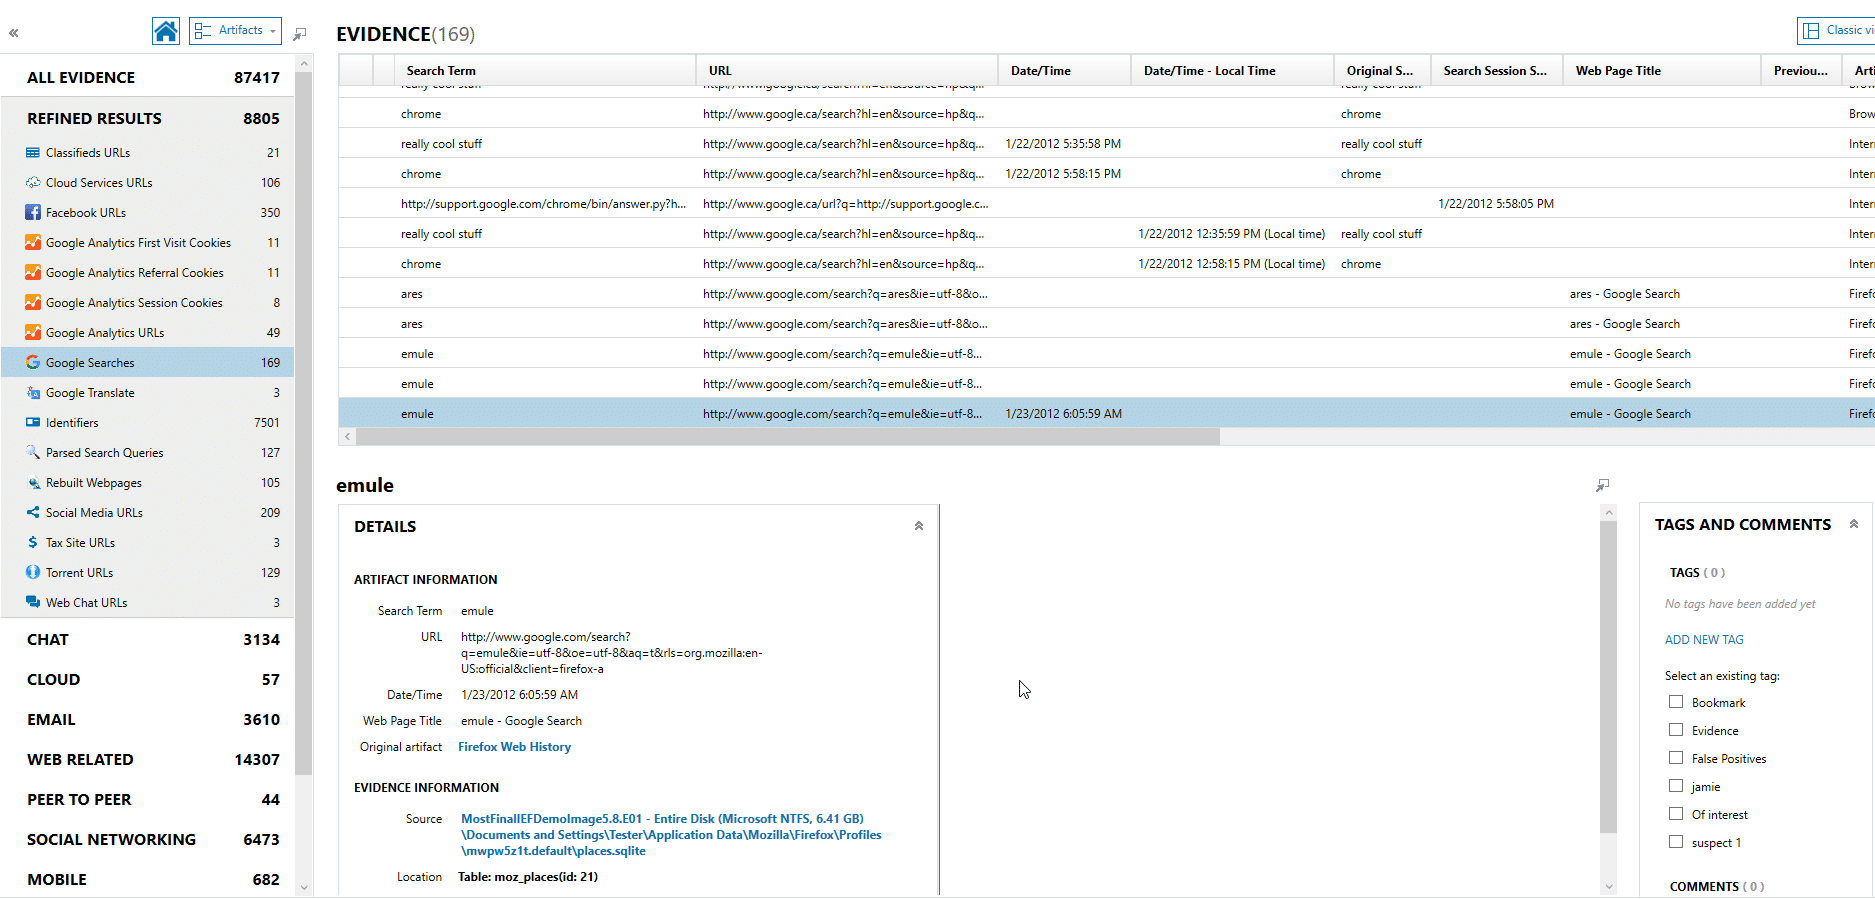
When you first open AXIOM Examine, you are presented with all of the artifacts found for the case in Column View. This will show a mix of artifacts and some common fields that you can use to compare the data between artifacts including timestamps. In this view, the artifacts will be listed on the left, the column view showing all the evidence in the center, and the details cards on the right of your screen.
Best use for Column View
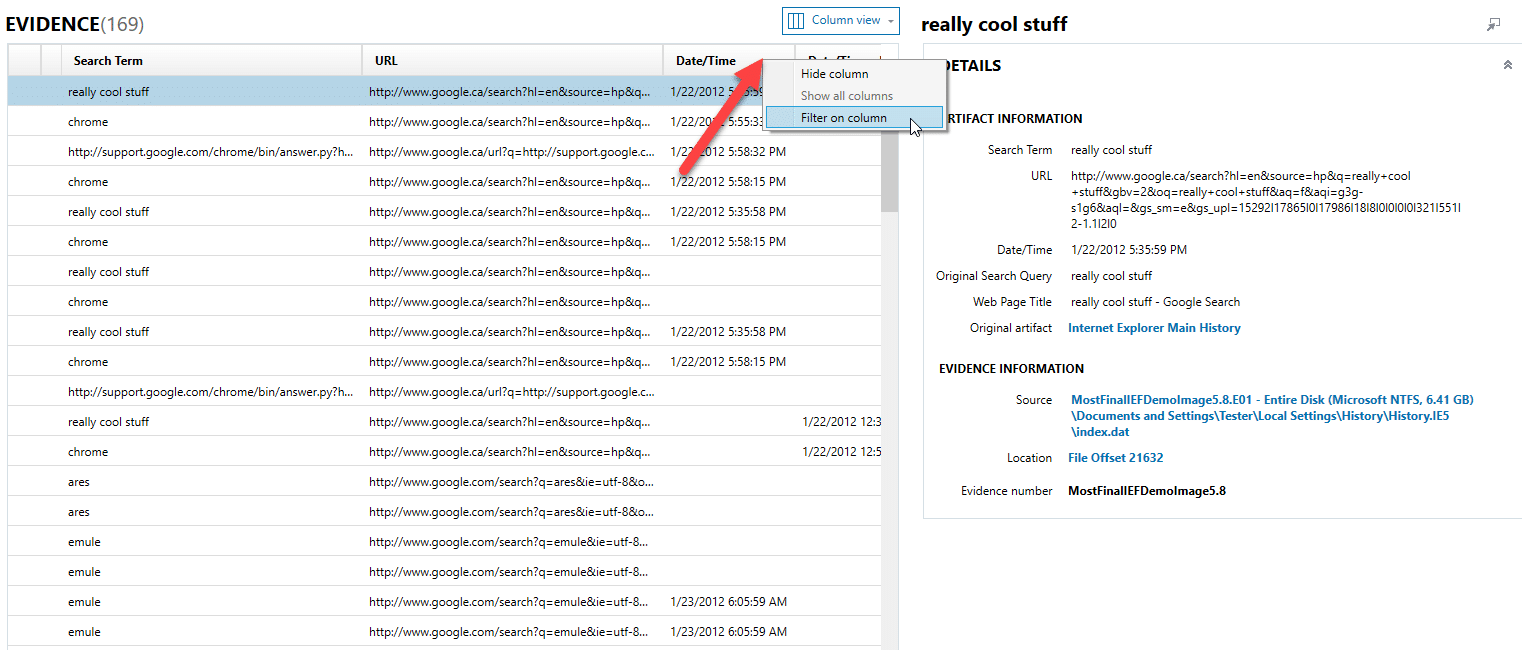
Column view is really valuable when you’re focusing in on a single artifact. This view will list all the columns available for that artifact and allow you to sort, filter, and organize the data any way you see fit. By right clicking on a column header, you’re given options to filter those individual columns depending on the data that is contained within. For example, you can run a keyword filter on a column that represents a string, a date/time filter for any timestamp, or a number filter on any column that contains numbers. You can also sort these columns and hide any columns that you don’t wish to see for your examination.
This is similar to how IEF presented the data however the artifact details are on the right of the screen instead of at the bottom.
Classic View
The Classic View is very similar to the Column View, however the artifact details are at the bottom of the screen (just as it was previously with IEF). If you want to keep the same look and feel as IEF, this is the view for you. Other than the location of the details pane, this view operates the same way as Column View above.
Chat Threading View
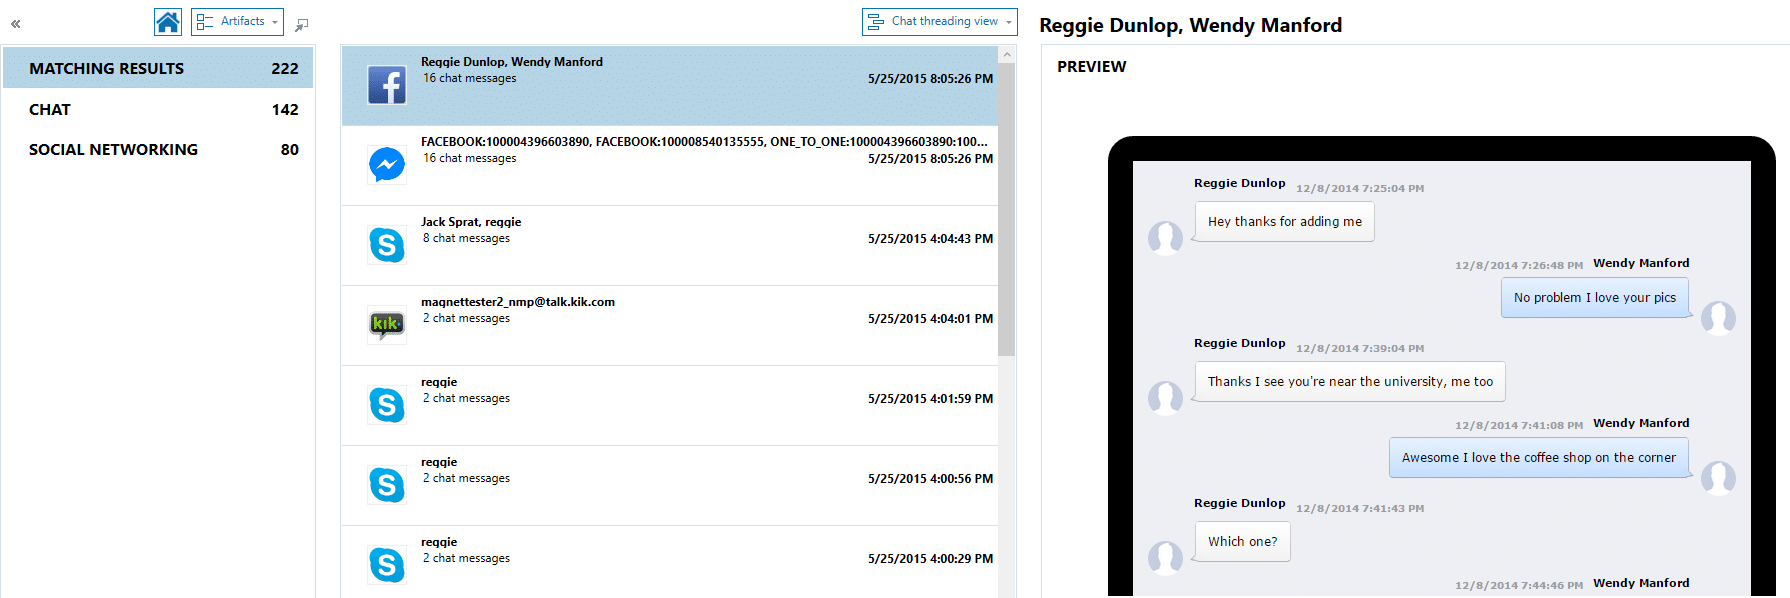
Chat threading was a very popular feature in IEF and we’ve included it in AXIOM. It allows you to present some of the most popular chat app data found in your examination in a conversation – as it would have been seen on the phone or computer.
Best use for Chat Threading View
This is a great view if you’re trying to present your findings to any stakeholders, especially if they aren’t very technical and want to see it in a way they may be familiar with.
Histogram View
Histogram View allows examiners to get a good high level view of the number of artifacts that were recovered from an image as it lists a bar graph of the number of hits for every artifact in your case starting with the highest number of records to the lowest.
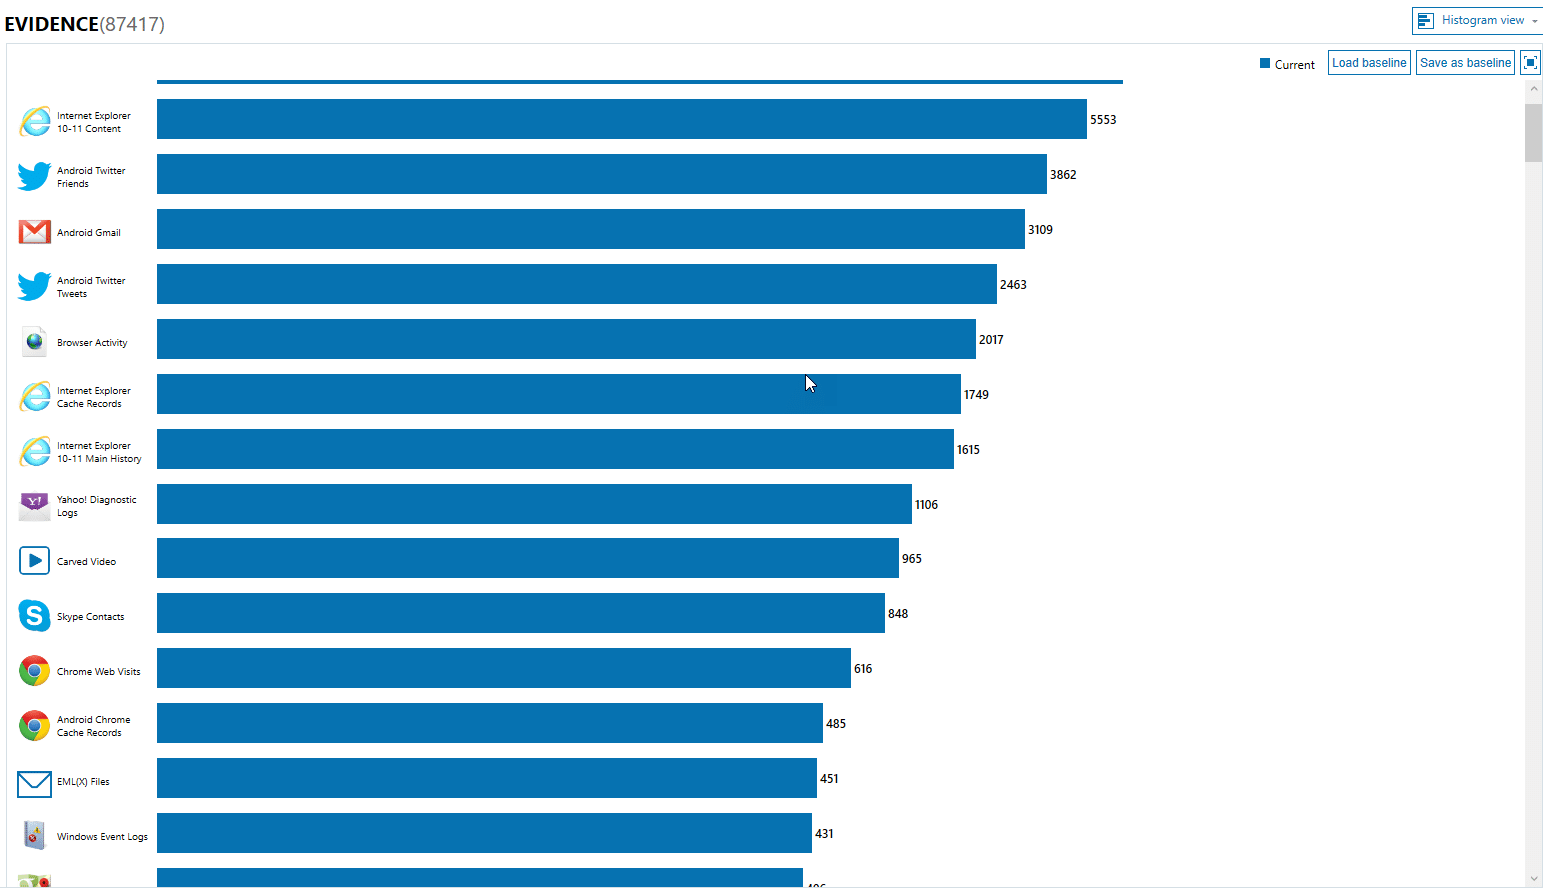
Best use for Histogram View
This view can help you identify any apps or artifacts that are used more frequently than others and areas to focus your investigation. You can also use Histogram View to build out baselines to compare different systems or the same system that has been examined at two different points in time. For example, I may use it to compare a baseline of a known good system to that of a system being investigated for a corporate policy violation. Alternatively, a parole officer may use it to examine the system of a parolee every month to ensure they are sticking to the conditions of their parole.
Row View
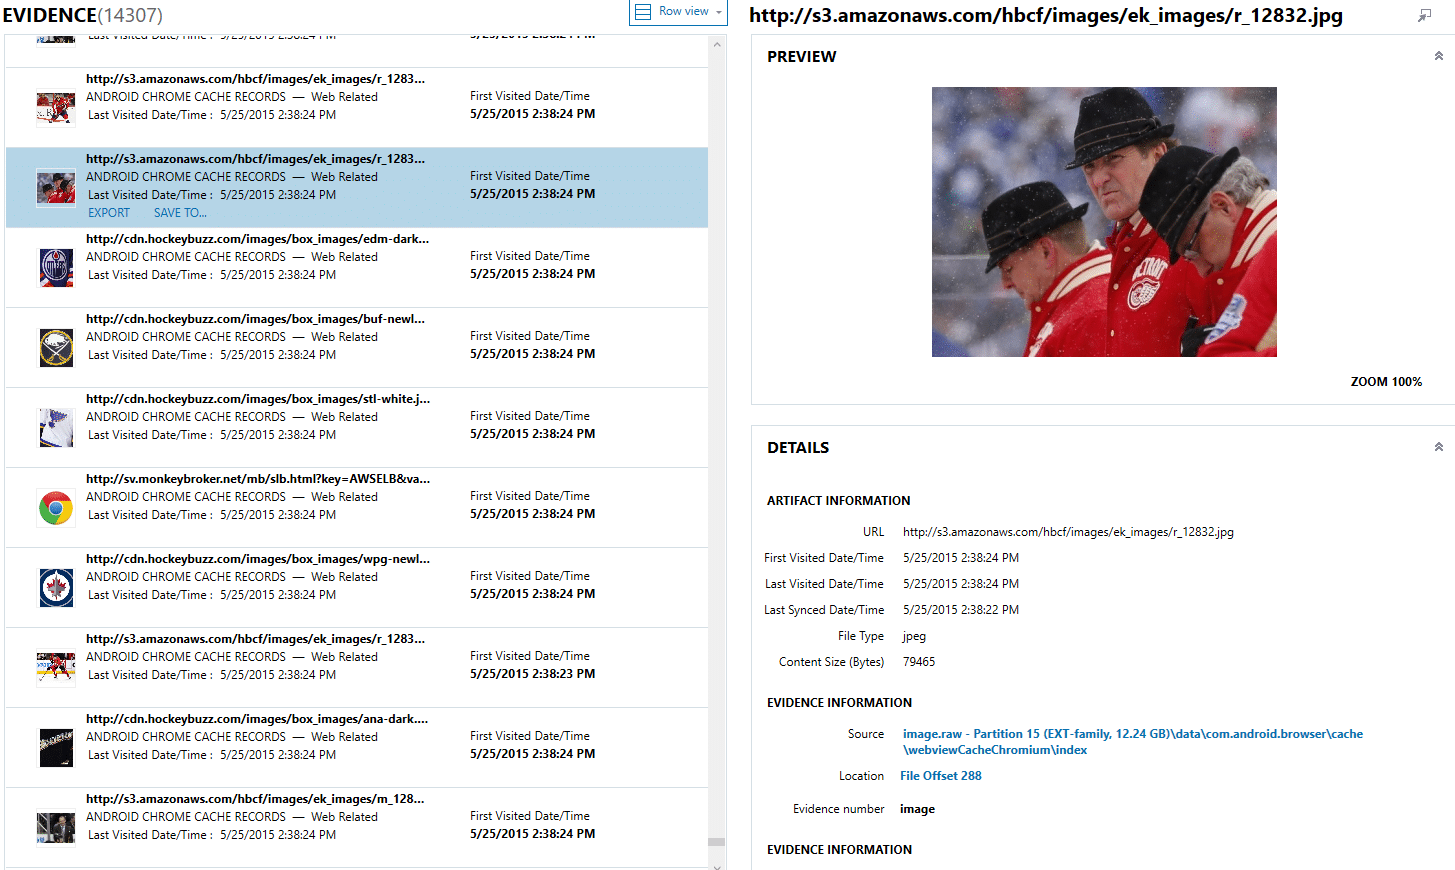
Row View allows examiners to easily compare records when multiple artifacts are selected and gives a good high level account of the data contained in those records. It will give previews of any picture artifact along with some of the most useful details for each artifact, including timestamps and geolocation.
Thumbnail View
Thumbnail View applies a filter to only show artifacts that contain pictures and is commonly associated to a gallery view which allows examiners to quickly review large datasets of pictures and visual data. You can choose the size of the thumbnails and can sort the data by right-clicking on a thumbnail and choosing a method you wish to sort the data.
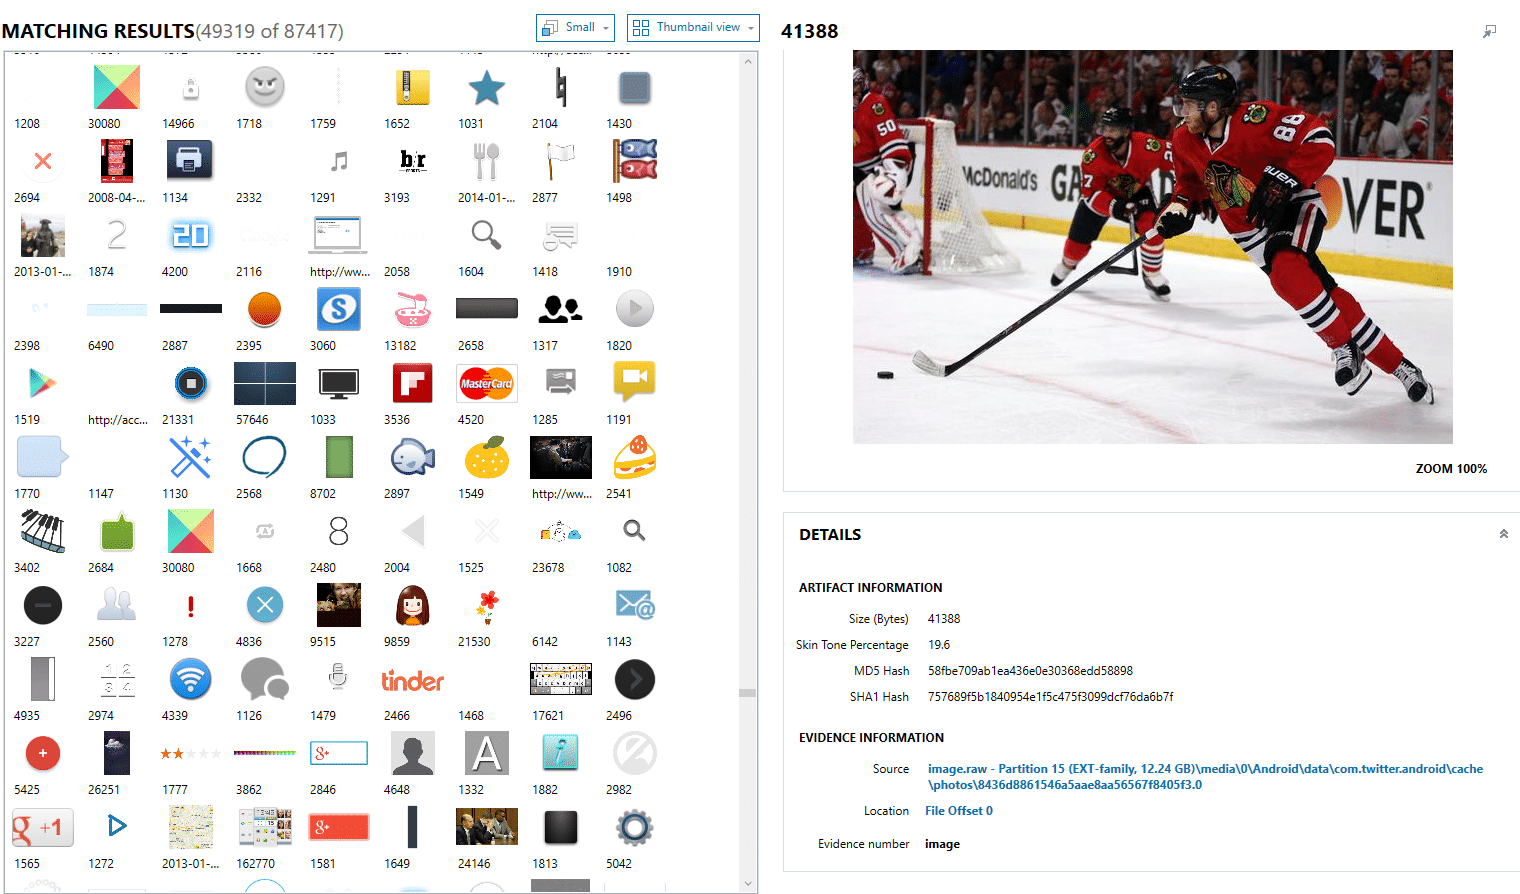
The Details card shows a preview of the picture, which can be clicked on to enlarge. Below the image is the metadata details which will typically include: MAC times, sizes, hashes, and any EXIF data present.
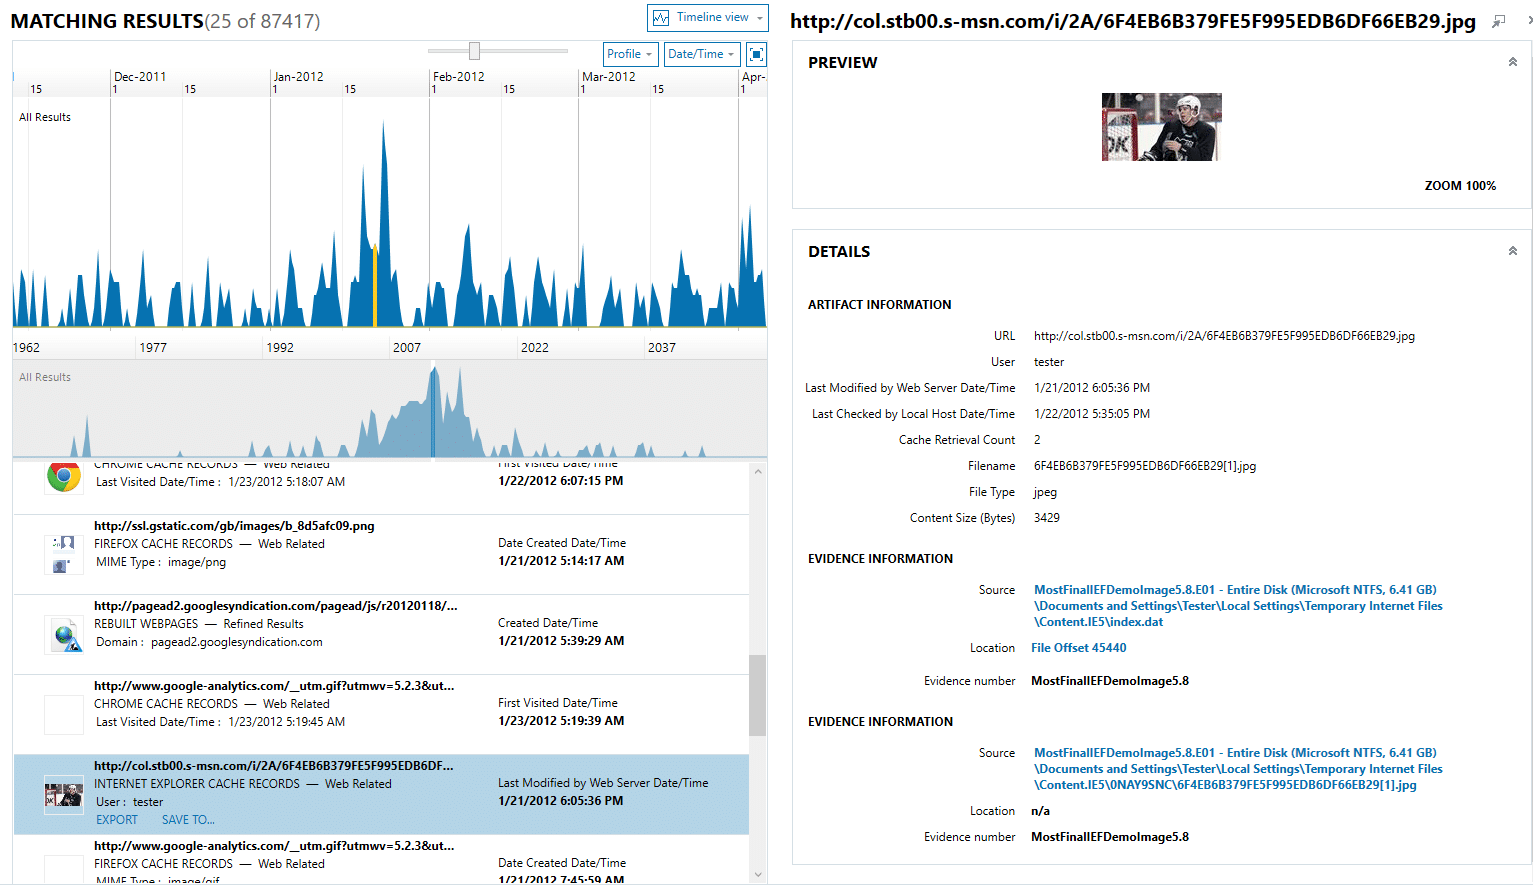
Timeline View
Timeline View is a great way to visualize artifacts based on the timestamps recovered by AXIOM. It applies a filter to only show artifacts that contain timestamps. Examiners are able to zoom into a particular area of focus, select only certain artifacts, and choose which type of timestamps to display. For example, if you only wanted to view the last visited time from all the browsers present on the system, you could apply a filter to only show those timestamps in the display.
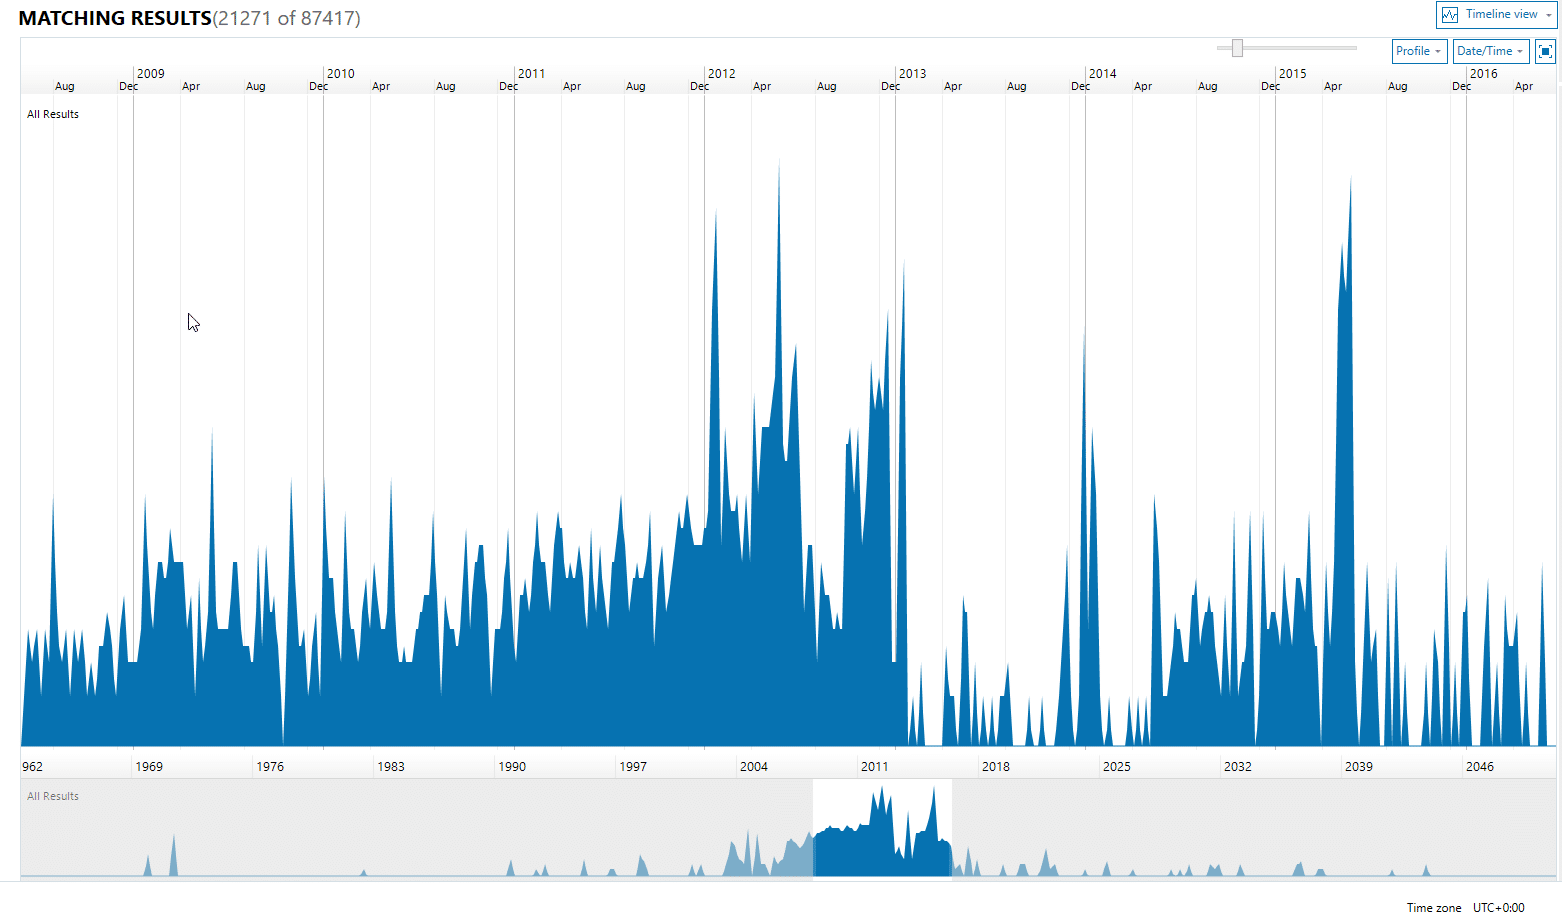
Once you have narrowed your search to the timeframe you’re interested in, you can select a sliver of time to view any artifact events that occurred at that time. Selecting “View Details” will present a more detailed view of those artifacts and allow you to identify anything else of value.
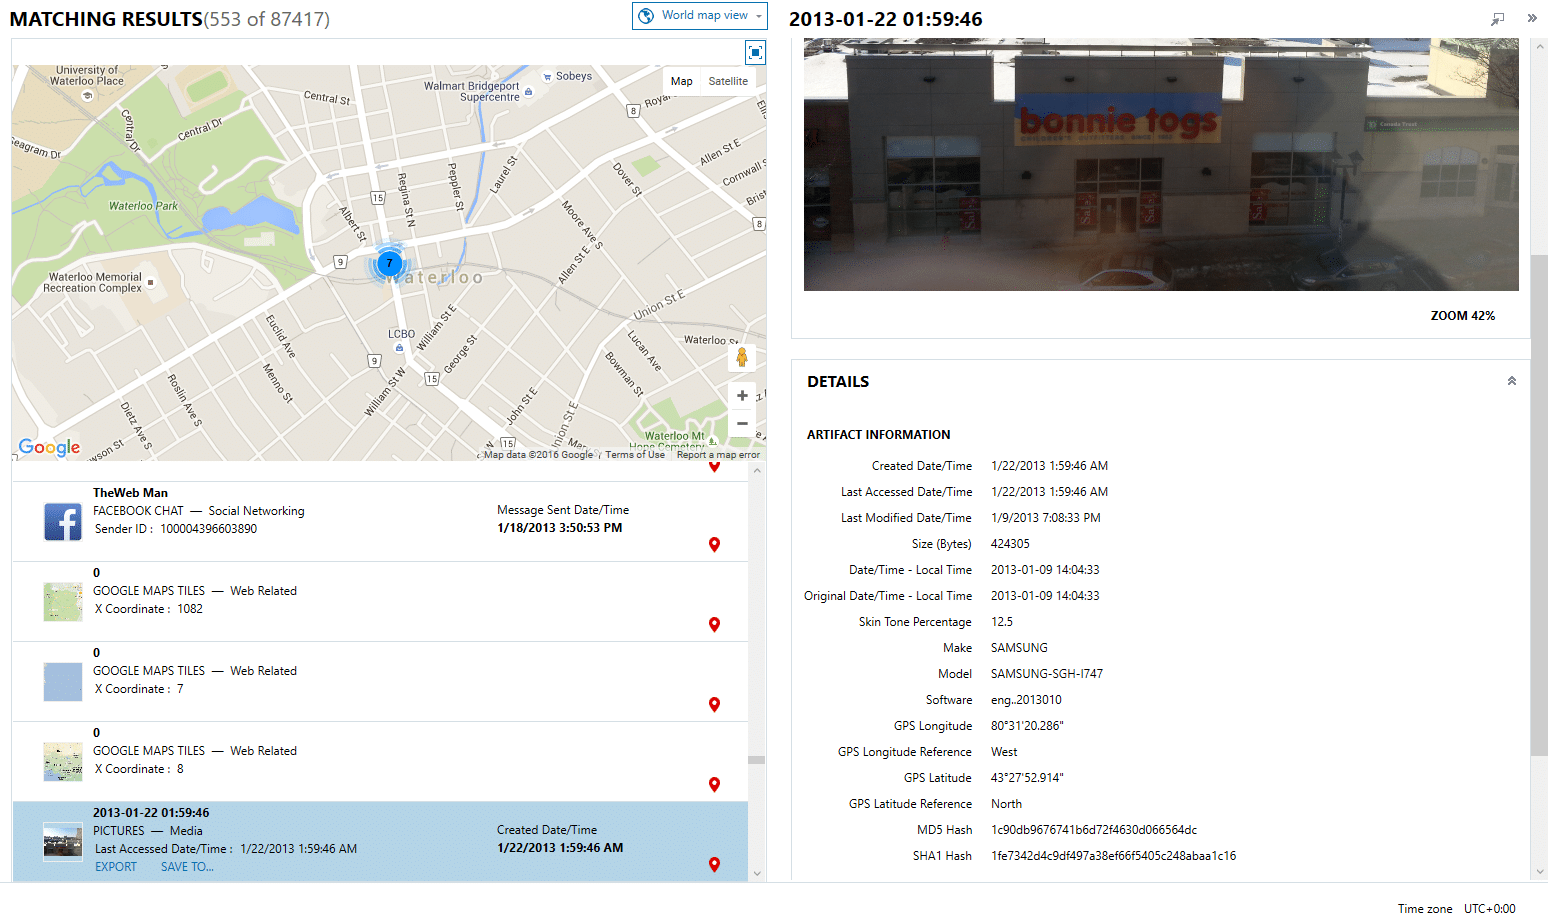
World Map View
The final view available in AXIOM is World Map View. This enables examiners to view any geolocation data recovered in their examination visually on a global map. World Map View uses the Google Maps API to display the data so it does need an Internet connection to work.
Best use for World Map View
This view is great for visualizing where a suspect might have been when they sent a particular chat message or took a photo that contained EXIF data.
How data is presented can help you focus on the more important details of complex information and can help narrow down the data for analysis when there is simply way too much of it. Looking at data from a multitude of views can also help non-technical stakeholders make sense of the information. This eliminates the need for lengthy verbal explanations and extended reports. With AXIOM Centralized Views, you can quickly and easily identify what’s important to your case.