
Magnet Process Capture – Saving Your Memory, One Process at a Time
I’m excited to announce the release of yet another free tool! Today we’re releasing Magnet Process Capture, a tool that allows you to capture memory from individual running processes.
We’ve had RAM capture capabilities for some time now – first (and still) in our IEF Triage tool, and then in Magnet RAM Capture, a stand-alone free tool. Those tools gave you an easy-to-use option for capturing all the system RAM on a computer. Sometimes that’s exactly what you need. Sometimes it can be overkill.
A tool that allows you to capture memory selectively (per process) is useful in situations where you don’t have much time (we know how long saving 16GB+ of RAM to a USB drive can take) and/or when you are only interested in specific processes. It can also provide less fragmented data resulting in better recovery of larger data types, as well as providing context on which specific processes contained any recovered artifacts if searching the captured memory with a tool like Magnet AXIOM.
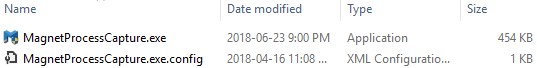
Let’s take a look at the tool and some of the unique functionality provided. First, download the tool and unzip the files to a folder. You’ll see a couple files:
Double-click MagnetProcessCapture.exe to get started – here we go:
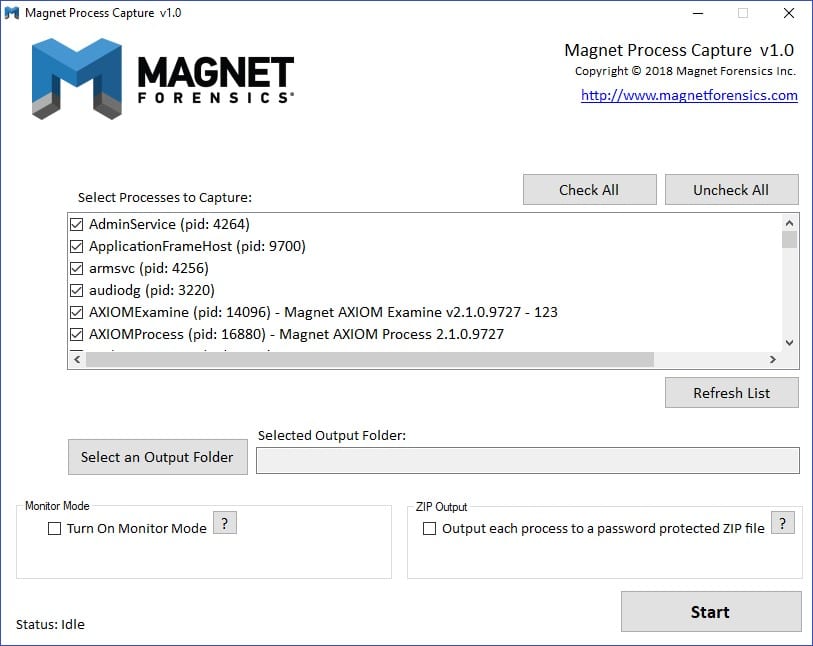
The layout is fairly straightforward. You can scroll through the list of running processes and use the “Check All” or “Uncheck All” buttons to quickly select processes of interest. The “Refresh List” button will reload an up-to-date list of running processes.
Once you’ve selected the processes you want to capture (or left them all checked), click “Select an Output Folder” to select a destination folder for the saved process memory files.
Next, we have a couple of interesting options. First, Monitor Mode. Turning this on allows you to continuously capture memory from selected processes, every X number of seconds (configurable once you turn on the feature). This can be useful when analyzing malware or profiling certain processes and wanting to capture the changes in memory after specific actions are taken or events occur.
To the right of Monitor Mode, we have a ZIP output option. Turning this option on will cause the memory of each selected process to be saved directly into a ZIP file, protected by a password (however, if you leave the password field blank, no password will be applied).
This can be useful to protect the output from being intercepted or deleted by any active monitoring process, like AV or malware. Note that this option negatively impacts performance and is only recommended for targeted captures.
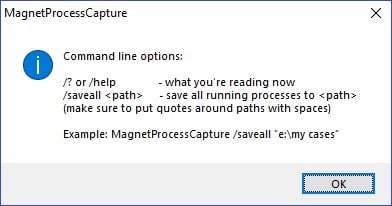
Finally, there is a command line interface!

The command line options (or option, rather 😊) are fairly simple at this time — /saveall allows you to automatically save all running processes to an output folder. Make sure to put the folder location in quotes if it contains spaces. You can see a simple example below, which is the help screen you’ll see if you don’t enter valid command line parameters:
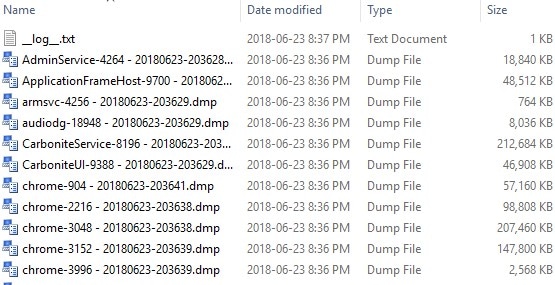
That’s it! Click “Start” in the GUI to start capturing, or use the command line interface in scripts to automatically capture processes. You’ll get output that looks similar to this:
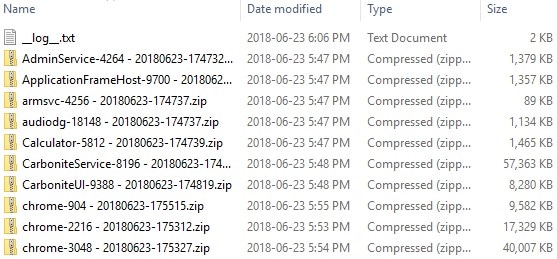
Or if you specified the ZIP output:
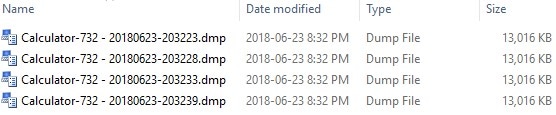
Or, if you used the Monitor Mode option:
As you can see in some of the screenshots, a “__log__.txt” file is created with any errors or warnings (processes that terminated before they could be captured) that occurred during the capture.
As an aside, the above capture in the first screenshot contained about 9.5GB of data and took a little under 45 seconds to complete!
So what next? Let’s try running a capture through AXIOM. To do this, we’re going to take this path under the Evidence Sources tab: Computer -> Load Evidence -> Files & Folders. You can either point AXIOM at the entire extracted folder or individual files (as long as they aren’t in password-protected ZIP files).
For this example, I loaded the entire folder of captured process memory files. Here’s what we have recovered from this sample capture:
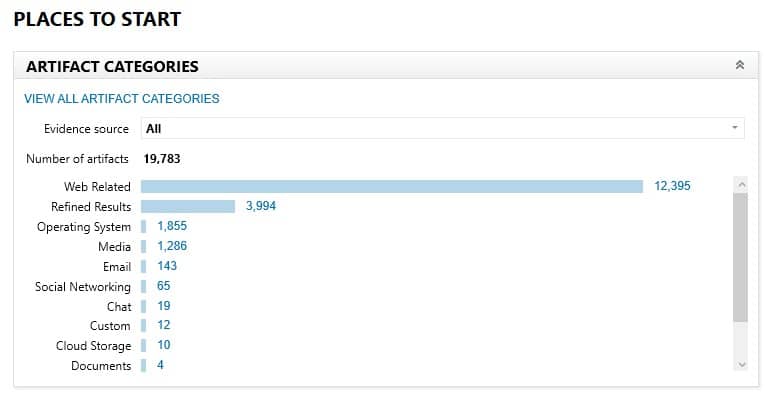
Not bad! Let’s take a look at a few interesting items. First, I used our Timeline view to see the timeframe of activity that was found in the process memory artifacts:
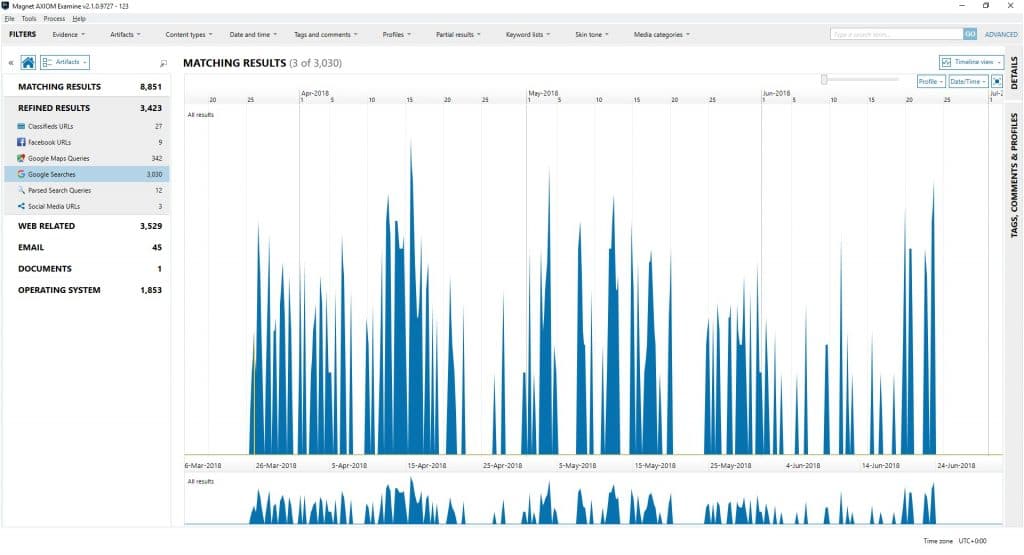
The above shows the Google Search activity, going back to early April! This system has been shutdown and restarted many times since April. Other artifacts such as lnk files and event logs go even further back, into last year.
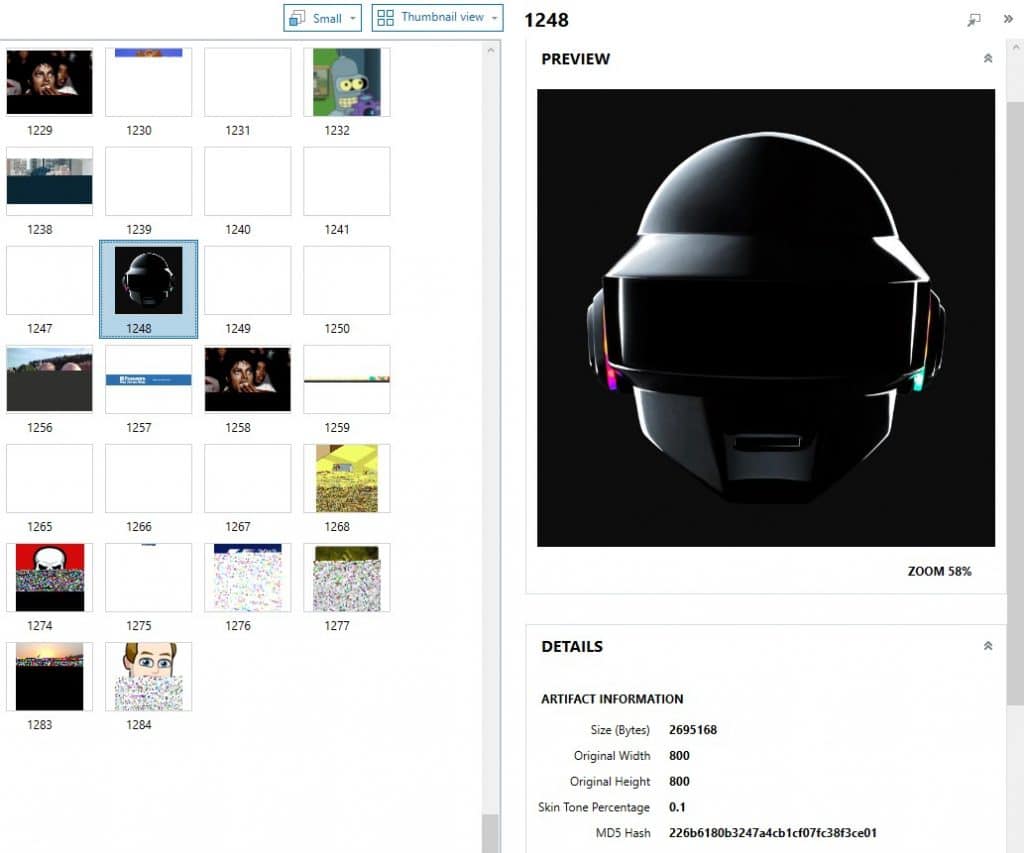
Next let’s look at some pictures that were recovered. The below photo is almost 3MB in size! That would be tough to recover intact from a full system RAM dump:
There’s lots more cool stuff in here, but we’ll close with these hits from a custom artifact I wrote to recover search terms/text that was typed into the Cortana search box:
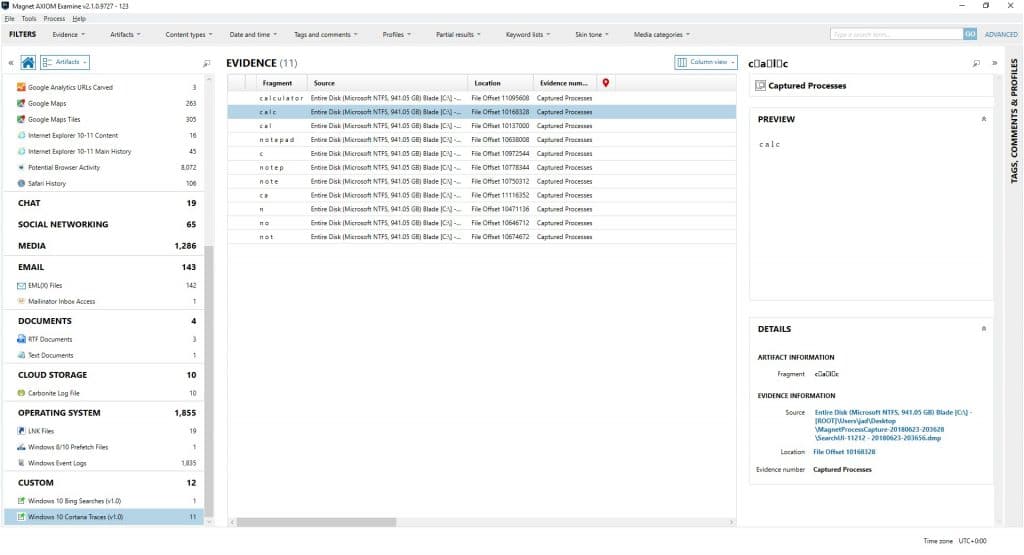
By looking at the Source column data, we can see that the hits for search terms or apps that were run came from the SearchUI process, pretty cool eh? You can also see that it tracks data as it is typed.
We’ll wrap it up there but please try the tool out and let me know what you think! Open to any and all feedback (good or bad!), new feature suggestions, or success stories on where the tool helped you out. You can find me on LinkedIn and Twitter.
Thanks for your continued support and we’ll see you next time!
All the best,
Jad and the Magnet team